

Аналитическая ультрацентрифуга Optima AUC
Когда-то компания Beckman Coulter представила первый инструмент для характеризации образцов методом аналитического ультрацентрифугирования (AUC), который открыл научному сообществу новые исследовательские возможности. Поддерживая традицию, в 21 веке компания выпустила новую AUC-систему – аналитическую ультрацентрифугу Optima AUC.
Надежная технология, лежащая в основе этого инструмента, позволяет получать данные для определения молекулярного веса белков в ходе фундаментальных исследований и количественной оценки степени агрегации в ходе научных и биофармацевтических исследований.
Хотите узнать больше об аналитическом ультрацентрифугировании?
- Загляните в нашу базу знаний;
- Познакомьтесь с коллекцией вебинаров об AUC.


Ключевые характеристики аналитической ультрацентрифуги Optima AUC
Качество данных
- Более высокое радиальное разрешение
- Более высокое отношение сигнал/шум по сравнению с ProteomeLab
- Интерференционная оптика дает в 11 раз больше пикслей в вертикальном направлении
- Точный анализ сложных систем при нескольких значениях длин волн (до 20) за минимальное время
Тип образцов
Предназначен для анализа широкого спектра частиц в нативной безматричной среде, включая:
- Белки
- Наночастицы
- Пептиды
- Полимеры
- Мицеллы
- Липосомы
- Внеклеточные везикулы
- Конъюгаты лекарственных вещества
- Частицы на основе вирусов
Анализируемые параметры
По сравнению с любой другой методикой получаемые при помощи Optima AUC данные позволяют определить больше характеристик образца:
- Размер
- Масса
- Диаметр
- Стехиометрия
- Гетерогенность
- Ассоциация
- Агрегация
- Чистота
- Химический состав
Простота эксплуатации
- Удобный сенсорный дисплей отображает выполнение протокола эксперимента.
- Возможность удаленного мониторинга позволяет вам настраивать инструмент, следить за процессом и получать данные, находясь практически в любом месте.
- Совместимость с ячейками и роторами системы ProteomeLab XL.
- Тумблеры для активации оптических систем упрощают подготовку к анализу.
Модели Optima AUC
Сопутствующие продукты для Optima AUC


Техническая документация
FAQ on the Optima AUC Analytical Ultracentrifuge
How do you analyze AUC data?
AUC data can be exported and analyzed using several different software packages including SEDFIT, UltraScan, SedAnal, SedPHAT, and more*.
Beckman Coulter Life Sciences released the Optima AUC cGMP Suite software, which helps with experimental setup, live data monitoring, analysis and report generation, while supporting 21 CFR Part 11 compliance.
*Third-party analysis software has not been validated by Beckman for use with the Analytical Ultracentrifuge. Beckman does not endorse any third-party analyses software. Beckman warranty and/or performance guarantee that may be applicable or are provided by Beckman for Analytical Ultracentrifuge do not apply to any third-party software.How is fringe displacement calculated?
The system performs a single-point discrete Fourier transform (DFT) at the frequency represented by the fringe vertical frequency. This transform is calculated on each vertical column of data, across the entire row. The phase of each calculation is used to calculate fringe displacement (1 fringe displacement = 360 degrees of phase shift).
How is the sedimentation coefficient determined?
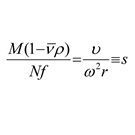
If you know the particle velocity (υ), the angular velocity (ω), and the radius from the axis of rotation (r), you can calculate the sedimentation coefficient (s).
Per the left side of the equation, this value is proportional to molecular weight (M) multiplied by buoyancy factor (1-v p and inversely proportional to the frictional coefficient. Large values of S (faster sedimentation rate) correspond to larger molecular weight.
What do fringe patterns from interference testing reveal?
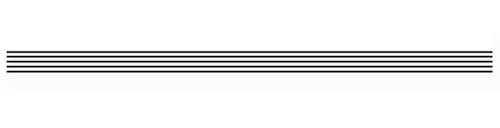
If the two beams pass through identical substances, the resulting fringe pattern is relatively constant across the length of the image, as shown here:
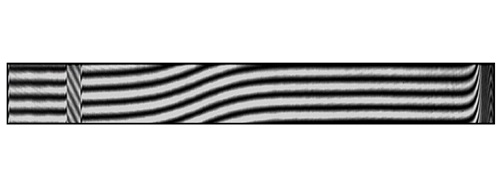
If the beams pass through different substances, and the concentration of one of them varies across the radial length, the fringe pattern shows interference as seen here:
How is sample detection done in an analytical ultracentrifuge (AUC)?
Two common types of optical analysis include UV/visible light absorbance (detecting wavelengths between 190 and 800 nm) and Rayleigh interference. Both rely on light passing through the sample, with a detector capturing the light after it passes through the sample. Data is collected in this manner over the course of the centrifugation, so that the sedimentation pattern of the sample can be tracked. Various calculations are made from the data to determine sample characteristics.
Do Optima AUC rotors differ from those for a preparative centrifuge?
Yes. AUC rotors are designed to address additional considerations, such as:
-
Light passage
AUC rotors are designed so light can pass through a sample, generally from top to bottom. -
Overspeed disk
To prevent damage, the overspeed disk allows the system to determine the maximum rated speed of the rotor and prevent it from spinning faster than that maximum. -
Timing magnet
This is embedded in the overspeed disk. A pickup device in the system senses when the magnet passes over and generates a pulse that represents a known time. The AUC uses this pulse to synchronize the rotor speed with the flash of the light source.
How is an analytical ultracentrifuge (AUC) counterbalance configured?
An AUC counterbalance not only offsets sample cell weight, but also provides a way to calibrate the optics.
Each counterbalance, which is always anodized red, features four reference holes with removable mask windows.
The inner edges of the reference holes should match the outer edges of the centerpiece cell. The counterbalance weight can be adjusted by screwing weights into the center of the counterbalance cell. Using the provided screw weights, the counterbalance must weigh within 0.5 grams of the sample directly opposing it in the rotor.
What is interference and how is it detected using analytical ultracentrifugation (AUC)?
There are two types of interference:
-
Constructive Interference
When crests/troughs of two waves meet, creating a crest/trough equal to the sum of their amplitudes. -
Destructive Interference
When the crest of one wave meets the trough of another, cancelling each other out. -
Constructive and Destructive Pattern from 2 Slits
If a light source is passed through two parallel slits, it creates constructive and destructive interference in a repeating "fringe" pattern that can be analyzed via AUC. The interference optical system, in the Optima AUC Analytical Ultracentrifuge, performs scans in which fringe displacement is measured as a function of radial distance.
