Flow Cytometric Analysis of auto-fluorescent cells found in the marine demosponge Clathria prolifera
Shunsuke Sogabe | The University of Queensland (AUS), Brisbane, Australia
E-mail: [email protected]
IN THIS PAPER YOU WILL |
||
Learn how flow cytometry can be used to view autofluorescent cells from aquatic samples |
Learn about a new type of cells identified in the demosponge, Clathria prolifera |
|
Introduction
Sponges are well known for their remarkable capacity for aggregation and reorganization. These phenomena were demonstrated in a classic experiment where sponge tissue is dissociated using fine mesh and observed over time to reaggregate, and in some cases forming a functional miniature sponge [1,2]. A recent study compared seven different sponge species and their reorganization capacities revealing only a few species are capable of forming functional sponges from dissociated tissue, as well as identifying checkpoints in the reaggregation process [3]. Clathria prolifera (formerly known as Microciona prolifera), a demosponge species found in the east coast of the US, is well known for it’s capacity to reaggregate from dissociation and form miniature sponges [2,4].
C. prolifera cells are rich in carotenoids giving them their bright orange color and general auto-fluorescence, excited by the 543nm laser [5]. However, our preliminary observation revealed a new subset of cells that are excited by 405nm laser. Using the CytoFLEX Flow Cytometer, the new 405nm excitable C. prolifera cell population was further characterized, namely their size, granularity and population percentage.
Material and Methods
C. prolifera were collected near the Marine Biological Laboratory (MBL), Woods Hole, MA by the Marine Resources Center (MRC). The cell suspension preparation generally followed the methods previously described by EerkesMedrano et al. [3]. Sponge tissue was cut into an approximately 5-cm3 cubes and the flow cytometric analysis performed within an hour of tissue dissociation. The tissue cubes were transferred into a 50mL conical tube filled with 0.22μm-filtered seawater (FSW) and transported to the flow cytometry facility in the Whitman Center, MBL. Calcium- and magnesium-free seawater (CMFSW) was made as previously described [6], in which the tissue cubes were dissociated by using a 20μm mesh. This cell suspension was then transferred to a 1.5mL microcentrifuge tube, which was used for the flow cytometry analysis. The samples were then run on a CytoFLEX Flow Cytometer (Beckman Coulter, Miami, US) with 3 laser 13 color capability. The threshold was set to automatic, and the acquisition was performed in slow mode (10μL/mL).
Results
The demosponge C. prolifera is able to reaggregate from dissociation and form miniature sponges [2,4]. The carotenoid rich nature of this demosponge gives it the bright orange color [5]. This species is also autoflourescent, which can be excited by the 543nm laser. Our study with this species collected at Woods Hole (Massachusetts, USA) unfolded a new subset of cells excitable by the 405nm laser (Figure 1). The new cells were initially observed under a fluorescent microscope with 405nm laser capability. Excitation using this laser resulted in only a subset of the cells displaying fluorescence in their cytoplasm. These cells seemed to be a specific cell type with a relatively large nucleus and cell size, indicative of the archeocytes (somatic stem cells of the sponge). Further observation under higher magnification has shown that this auto-fluorescence is specifically emitted from numerous vesicles of uniform size packed inside the cells, which display dynamic movement within the cell (Figure 2). Since these cells resemble archeocytes, which are known for their high phagocytic activity, it is possible that these vesicles are lysosomes and the fluorescence comes from a component or the product of the process of digestion.
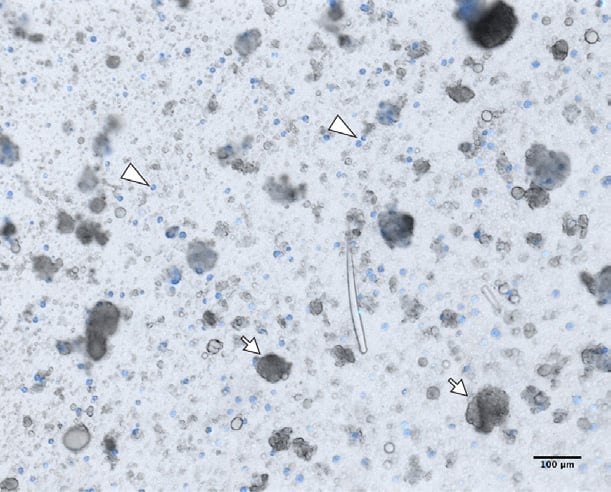
Figure 1. Dissociated Clathria prolifera tissue.
Auto-fluorescent cells excited by the 405nm laser (blue). Dissociated Clathria prolifera cells in filtered seawater (FSW). Single cells, including the auto-fluorescent cells (arrowheads) immediately start re-aggregating after dissociation, with a few sponge cell aggregates (SCAs) already starting to form (arrows). Note that aggregates are formed from both fluorescent and non-fluorescent cells. Scale bar 100 μm.
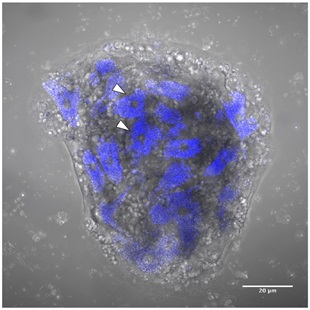
Figure 2. Sponge cell aggregate at 12 hours post-dissociation of Clathria prolifera cells.
Auto-fluorescent cells excited by the 405nm laser (blue). Sponge cell aggregate (SCA) at 12 hours post-dissociation of C. prolifera cells in filtered seawater (FSW). A subset of the cells in this SCA displays auto-fluorescence in their cytoplasm (arrowheads), which is emitted by the vesicles contained in these cells. Scale bar 20 μm.
Flow cytometric analysis on these fluorescent cells is beneficial in a number of ways. Since not much is known about these cells, analyzing the nature of the fluorescence and quantifying their abundance in the sponge body is essential in characterizing this population. In addition, sorting and isolating these cells will enable further analyses and experimental approaches on these cells, including RNA sequencing to identify key genes involved in the autofluorescent capacity of the vesicles in these cells. The technique described in this article shows how using CMFSW (calcium- and magnesium-free sea water) enables flow cytometric analysis on live single cells of a marine sponge that normally undergo rapid reaggregation, a technique which could be applied to other marine organisms. Therefore further investigation with a CytoFLEX Flow Cytometer with 405nm, 488nm and 638nm laser capability was performed to help quantify this new cell population.
The dissociated C. prolifera cells were acquired at slow (10μL/mL) flow rate using CytoFLEX Flow Cytometer, and a total of about 40,000 cells were collected. Large granular cells identified by high forward and side scatter were gated to compare these to the major population of non-granular cells, using the FSC and SSC dot plot (Figure 3A). This gated population was then displayed in all 13 parameters as histogram plots to determine which population of cells is autofluorescent (Figure 3B). The histogram plots revealed that the large granular cells were excited by only the 405nm laser, and displayed a well-resolved peak of autofluorescence across the visible spectrum from 450-780nm. The resolution was best with 525nm (KO525) and 610nm (Violet 610) with almost a decade difference between the positive peak and the non-granular cells. It can be concluded that the peak emission of this population is between 525nm and 610nm, consistent with results from the microscopy experiments. Further quantification showed that this population of interest is about 3.87% of all the events acquired (Figure 3A).
The blue laser excited weaker autofluorescence of both the granular and non-granular populations; the autofluorescence was weaker than the violet laser and the populations were not resolved. The autofluorescence of all cells was least excited by the red laser, which would make this a potentially useful channel for immunofluorescence staining or use of vital dyes to label the cells with less interference from autofluorescence.
The next step will be to sort and isolate these cells to enable further analyses and experimental approaches on these cells, including RNA sequencing to identify key genes involved in the auto-fluorescent capacity of the vesicles in these cells.
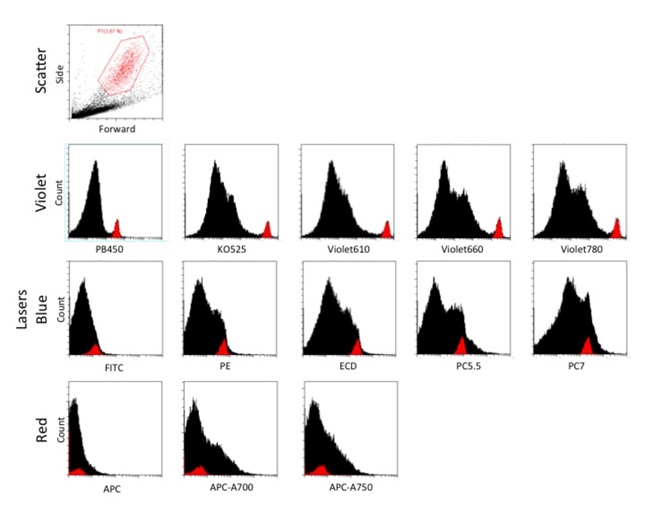
Figure 3. Dissociated Clathria prolifera cells acquired at slow (10μL/mL) flow rate, and a total of about 40,000 cells were collected. The subpopulation of large granular cells was gated with a FSC and SSC dot plot. This gated population is displayed in all 13 parameters as histogram plots to observe the resolution of the large granular subpopulation from the rest of the cells. The x-axis range is fixed at 102 to 106 for all fluorescent parameters.
Discussion
The results shown here demonstrate the identity of a new population of cells in the demosponge, Clathria prolifera. These cells are distinct in their ability to be visualized by autofluorescence from the 405 nm laser. Additionally, this work demonstrates the ability of the CytoFLEX flow cytometer to be used in marine/aquatic biology.
References:
- Wilson HV. Science 1907 25:912-915.
- Wilson HV. J Exp Zool 1907 5:245-258.
- Eerkes-Medrano D, Feehan CJ, and Leys SP. Invertebr Biol 2015 134:1-18.
- Wilson HV, and Penney JT. J Exp Zool 1930 56:73-147.
- Litchfield C, and Liaaen-Jensen S. Comp Biochem Phys B 1980 66:359-365.
- Müller WEG, Müller I, Pondeljak V, Kurelec B, and Zahn RK. Differentiation. 1978 10:45-53.
Note:
The results demonstrated in this application sheet represent those generated on the Beckman Coulter CytoFLEX Flow Cytometer. As differences exist in the performance between analyzers, the author cannot guarantee a similar appearance with the use of other flow Cytometers.
For Research Use Only. Not for use in diagnostic procedures.
